

Efficiency of the immunome protein interaction network increases during evolution
- Research
- Open Access
Efficiency of the immunome protein interaction network increases during evolution
- Csaba Ortutay1_24Email author and
- Mauno Vihinen1_24, 2_24
- Received: 23 January 2008
- Accepted: 22 April 2008
- Published: 22 April 2008
Abstract
Background
Details of the mechanisms and selection pressures that shape the emergence and development of complex biological systems, such as the human immune system, are poorly understood. A recent definition of a reference set of proteins essential for the human immunome, combined with information about protein interaction networks for these proteins, facilitates evolutionary study of this biological machinery.
Results
Here, we present a detailed study of the development of the immunome protein interaction network during eight evolutionary steps from Bilateria ancestors to human. New nodes show preferential attachment to high degree proteins. The efficiency of the immunome protein interaction network increases during the evolutionary steps, whereas the vulnerability of the network decreases.
Conclusion
Our results shed light on selective forces acting on the emergence of biological networks. It is likely that the high efficiency and low vulnerability are intrinsic properties of many biological networks, which arise from the effects of evolutionary processes yet to be uncovered.
Keywords
- Degree Distribution
- Scale Free Network
- Protein Interaction Network
- Evolutionary Level
- Preferential Attachment
Background
Evolutionary pressures shaping protein interaction networks are practically unexplored, although the importance of such studies has been recognized [1]. The earlier studies addressing this question analyzed the conservation of network motives [2, 3, 4, 5], or the rate of link dynamics in interaction networks [6, 7]. Although the importance of different protein properties to the evolution rates of proteins has been questioned [8, 9, 10], proteins interacting with multiple partners simultaneously have been shown to have a slower pace of evolution [11]. Thus, the properties of interaction networks can be thought to influence the evolution of organisms. More general knowledge about the effectors shaping protein interaction networks would give insights on several aspects of the formation of complex biological systems.
For detailed analysis of the evolution of a protein-protein interaction (PPI) network it is necessary to have knowledge about the emergence of all the proteins in the network and their interactions. Some investigations in this line have been presented [12, 13]. The problem is that the steps which lead to the current situation cannot be directly addressed. To be able to follow the development in biological systems, information about biological evolution should be applied. One attempt in this direction was to use so-called isotemporal categories to express the appearance of a gene or protein in organisms [14].
DNA and protein sequences hold their past in their structure, which can be reconstructed with the standard tools of phylogenetics. Here we performed to our knowledge the first PPI network analysis utilizing phylogenetic information. One of the reasons for the lack of this kind of study is the problem of obtaining accurate and validated data for a system that covers the biological network, its gene and protein constituents and their evolutionary history and homologs. We have collected such data for the human immune system.
The human immune system, which is one of the most complex biological machineries, has been widely investigated at the molecular, cellular and organ level in its normal state and during disease. It is a very complex system built up from several different tissues, cell types, molecules and processes. The evolutionary history of the human immune system is widely studied (see e.g. [15]), but we still need new data to complete the picture.
The Essential Human Immunome is a reference collection of genes and proteins involved in human immunity which is distributed in the Immunome database [16, 17]. Evolutionary data for all these proteins is collected in the ImmTree database [18]. Experimentally verified protein-protein interaction data for the immunome proteins was collected from the Human Protein Reference Database (HPRD) [19] and used to reconstruct the protein interaction network.
Recently, several studies have been published about natural networks [20], ranging from social interactions [21, 22] via protein-protein interactions [23, 24] to the spreading of epidemics [25] as well as human made networks like telecommunication networks [26, 27] and the Internet [28, 29]. It was initially surprising that the different networks share several common characteristics, which suggests common organizing principles for their emergence [30].
Preferential attachment [31, 32, 33] suggests that a new protein is more likely to be connected to a highly connected protein than to a protein with fewer interactions. Networks built up according to this principle, have been shown to have scale free characteristics [34, 35]. Scale free networks have been detected from several different sources, but thus far it has been very rare to observe the preferential attachment rule at work, especially in the case of protein interaction networks [36, 37].
The evolution and development of networks has been widely studied [38, 39]. Many earlier reports on the evolution of protein interaction networks have focused on yeast high throughput datasets [14, 40, 41]. Evolutionary comparisons have been limited to a few reference genomes. The new dataset on the human immunome [16] related proteins and their evolution allowed us to assign evolutionary levels to the proteins [18]. These levels can be interpreted as indicating the steps of emergence of proteins. Reliable protein interaction data can be assigned from HPRD, which contains experimentally verified interactions from literature [19]. We studied the emergence of the immunome PPI network and elucidated which of the network parameters are shaped by evolutionary pressures and how these parameters have changed during time.
Results and discussion
Network parameters for the human immunome at the evolutionary levels of the corresponding subnetworks.
Evolutionary level |
Taxon name |
Nodes |
Edges |
αa |
SE(α)a |
-2logΛa |
|---|---|---|---|---|---|---|
0 |
Homo sapiens |
584 |
1349 |
2.226 |
0.0677 |
1713 |
1 |
Mammalia ancestors |
577 |
1335 |
2.235 |
0.0683 |
1699 |
2 |
Amniota ancestors |
453 |
1039 |
2.260 |
0.0790 |
1304 |
3 |
Tetrapoda ancestors |
357 |
770 |
2.332 |
0.0950 |
970 |
4 |
Vertebrata ancestors |
354 |
761 |
2.319 |
0.0950 |
957 |
5 |
Chordata ancestors |
159 |
254 |
2.607 |
0.1924 |
303 |
6 |
Coelomata |
145 |
223 |
2.725 |
0.2144 |
267 |
7 |
Bilateria ancestors |
106 |
124 |
3.478 |
0.4107 |
115 |
8 |
Fungi/Metazoa ancestors |
62 |
57 |
4.376 |
0.9953 |
29 |
9 |
Eukaryota ancestors |
48 |
39 |
4.585 |
1.5668 |
12 |
Further, interactions for low level subnetworks, levels 6–9, were collected for Drosophila melanogaster [42, 43] and Caenorhabditis elegans [42]. This was done to reconstruct early interactions between immunome proteins which might have been lost during the evolutionary processes. Only 13 new interactions were identified in these subnetworks and thus they did not affect the overall trends. It would have been beneficial to have PPI data for model organisms on all the 10 evolutionary levels. This is not currently possible due to lacking proteome wide PPI networks.
For the analysis, we made some assumptions. We used PPIs identified in the human proteome, and assumed that if two proteins which interact in human, they also interact in any organism in which the two proteins coexist. We also assumed that this interaction existed during the evolution since both of the proteins emerged in a linage. The model is a simplification of all possible cases. This assumption is also in use in interaction predictions [44, 45], and although not exclusive, it is still true for the majority of interactions. Our results for interactions in fruitfly and worm confirm this idea, because hardly no new interactions were found in these low level subnetworks. The model simplifies the evolution of the entire interaction network to the evolution of its nodes. This is necessary since we do not have a method to track the evolutionary past of interactions, while the phylogenetic analysis of the proteins has well established and accepted procedures.
The human immunome PPI network contains 1349 interactions for 584 proteins (Table 1). Since the network includes only experimentally proven interactions from the HPRD database, we can assume it represents a real, albeit incomplete, network model of protein interactions in the human immune system. Not all the immunome proteins are included because the data is not complete and does not cover all proteins in all cell types and conditions.
Of the investigated proteins, protein-tyrosine kinase FYN has the highest number of interactions. The subnetwork of FYN and its first neighborhood includes 47 proteins and 93 interactions, which account for about 8% of all the immunome nodes and 6.9% of interactions. Another Src-family member, lymphocyte-specific protein tyrosine kinase (LCK), is the second most linked protein with 37 interactions. 64 of the 584 proteins have more than 10 interactions. Many of these are mediators of signal transduction pathways, for example the Janus kinases (JAKs), the signal transducer and activator of transcription (STAT) family members, and the TNF receptor-associated factors (TRAFs) (see Additional file 1).
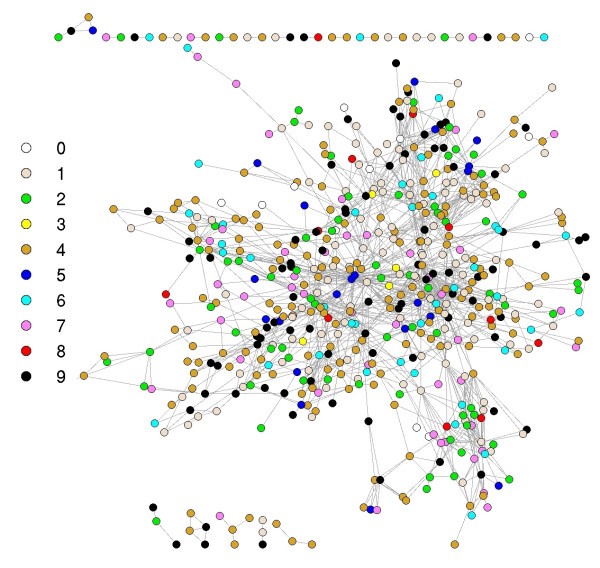
Graph representation of the immunome network at the evolutionary levels. Colors represent the levels of nodes as shown. See Additional file 2 for gene names and the network on the different evolutionary levels.
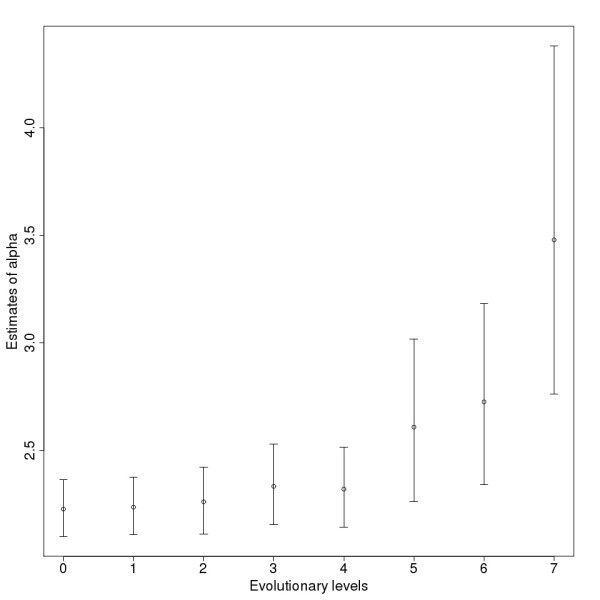
Estimates for the power law exponents (α) of the networks on the different levels. The bars show the confidence intervals with the 2.5% lower and 97.5% upper boundaries.
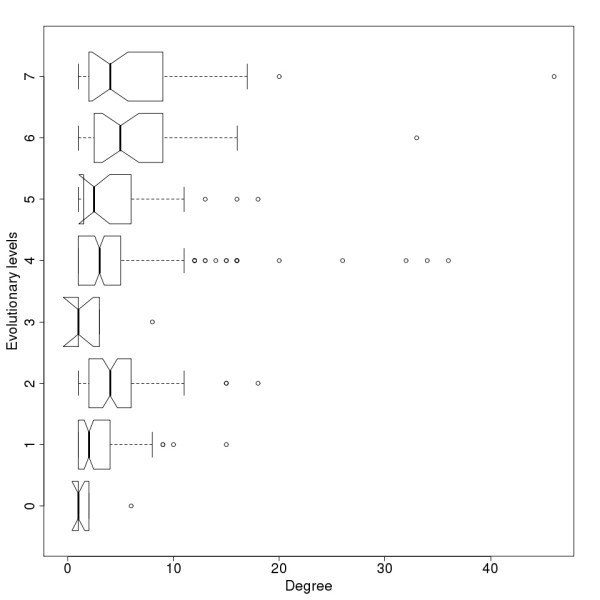
Degree distribution for evolutionary levels of the protein-protein interaction network. Notches represent the 95% confidence interval of the median.
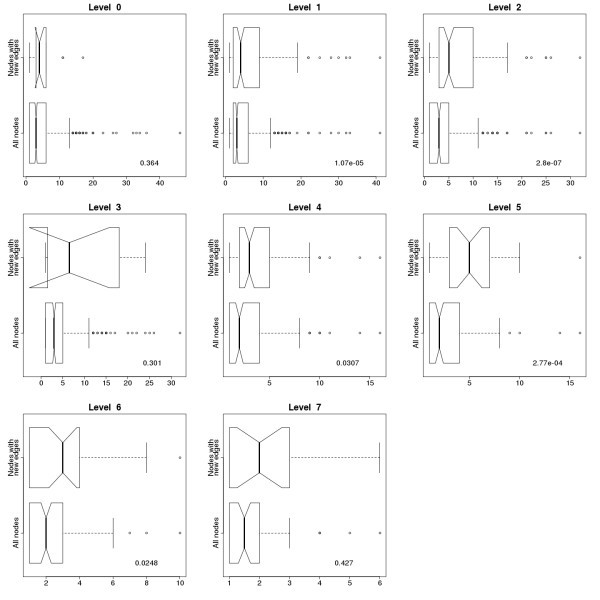
Comparison of degree distributions of all the nodes and the nodes with new connections in the immunome protein interaction network at evolutionary levels 0–7. Degree distribution for all the edges in the network is on the lower half of the subgraphs, while degree distribution only for nodes with new connections, representing the proteins with newly formed interactions, is on the upper half. P values for the Kruskal-Wallis Rank Sum Test are shown on the plots. Nodes with new connections have higher degrees than the others, and the difference is considered significant at levels 1, 2, 4, 5 and 6. Notches represent the 95% confidence interval of the median.
We used scale free models although the immunome protein interaction network, like other PPI networks, does not contain enough nodes to fulfill the statistical criteria for scale freeness. Therefore we mostly used general descriptive measures of networks, like efficiency, and avoided in our conclusions the scale free network specific aspects.
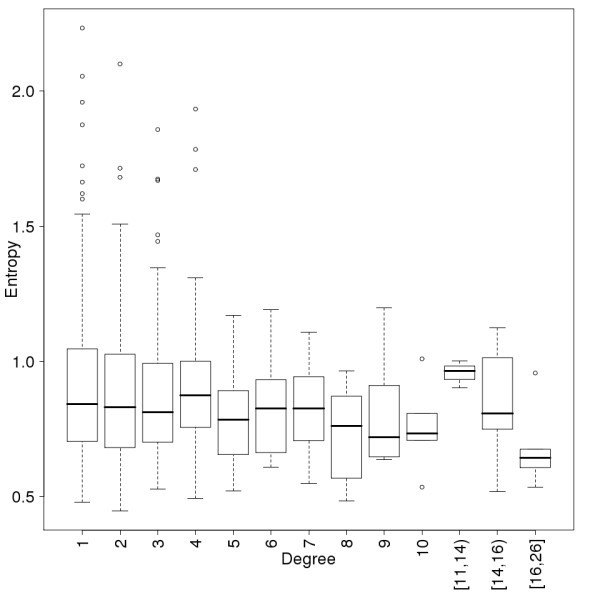
Conservation of the proteins as a function of their connectivity in the human immunome PPI network. Conservation is measured by the average entropy of the proteins. Data points are binned so that a minimum of 6 points are in each degree interval. The conclusion, that proteins with high connectivity never have high entropy, does not depend on the binning. The notation [11,14) means a bin for degree values 11, 12 and 13.
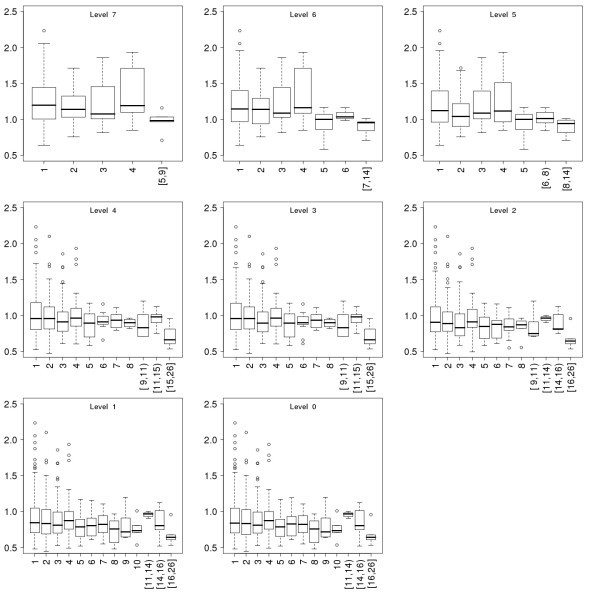
Conservation of the proteins as a function of their connectivity in the immunome protein-interaction networks at the eight evolutionary levels. Data is presented in the same way as for Fig 5.
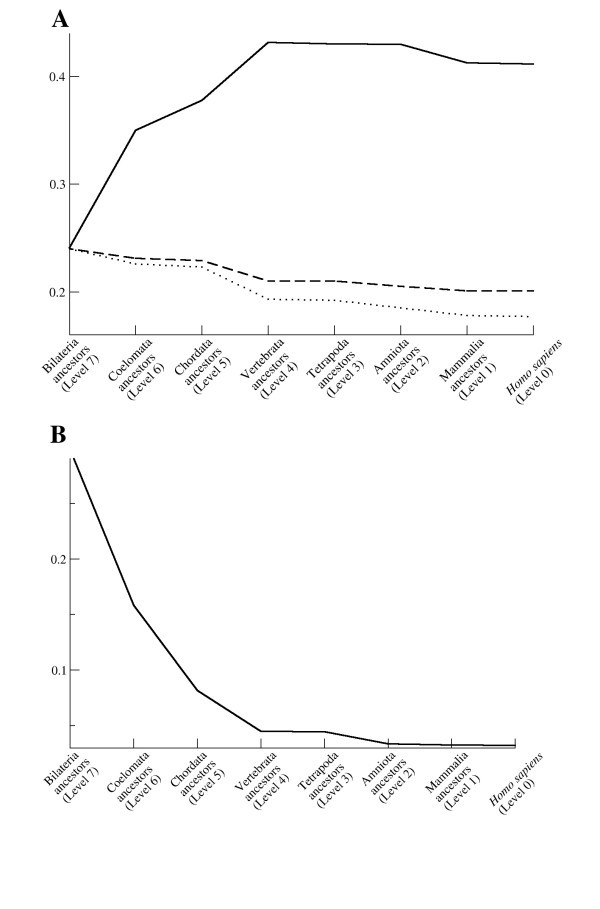
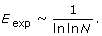
Characteristics of the human immunome network during evolution. (A) Efficiency (solid line) and expected efficiency calculated as a function of 1/(ln ln N) (dashed line), and 1/(ln N) (dotted line), where N is the number of nodes in the network. Expected efficiency curves are scaled to have the same starting values as the observed network. The shape of the observed efficiency curve shows an opposite trend than expected, suggesting that selective forces during evolution favor higher efficiency. (B) Maximal vulnerability.
The critical components of a network can be searched by looking for the most vulnerable nodes [49]. Vulnerability is defined as the drop in efficiency when a node and all its edges are removed from the network. The maximal value of the vulnerability is the overall vulnerability of the whole network. The maximal vulnerability of the immunome network constantly decreases during the evolutionary steps from the initial value of 0.28 (Fig 7B). At the level of Homo sapiens (level 0) the value is 0.003, which means that maximal drop in the efficiency of the network is 0.3% if one of the nodes is deleted from the network. Scale free networks are known to be tolerant of errors in randomly chosen nodes [28], a feature that is also important for biological interaction networks.
Conclusion
Our findings of the increasing efficiency and the decreasing vulnerability of the evolving network also raise new aspects in evolution. Apparently, it is advantageous for an interaction network to become more efficient and less vulnerable to random errors. More robust networks can possibly increase the fitness of the organism. It is likely that similar behavior will be found from some other biological, and possibly other types, of networks. Our analysis revealed new concepts for evolutionary biology, as well as new insights on the emergence of scale free networks. Large scale experimental studies are needed to test and verify the observed network properties and their effect during evolution.
Methods
Reconstructing the human immunome related protein-protein interaction network
Human immune system related proteins were collected from the Immunome database, which is a reference set for the human immune system composed by a combination of literature analysis and data mining [16]. Protein interactions were associated with the immunome proteins according to the Human Protein Reference Database (HPRD) [19]. Since only interactions between the immunome proteins were taken into account, no new nodes were added, but proteins without interactions were eliminated from the dataset. The final network contains 584 nodes out of the 847 original ones, forming altogether 1349 interactions. Interactions which appeared more than once were simplified to single edges.
Generating subnetworks at ten levels of evolution
Evolutionary information was assigned to all the proteins of the network. The data was taken from the ImmTree database [18] which represents ten evolutionary emergence levels from Eukaryota (level 9) to Homo sapiens (level 0) (Table 1) [16]. The numbers are the unified evolutionary levels from the database. The emergence levels were defined by analysis of the orthologs of each protein, and they represent the earliest common ancestor of species where orthologs of a protein can be identified. For example in the case of the FYN gene for protein-tyrosine kinase fyn, the ortholog from the largest evolutionary distance according to the ImmTree database is C. elegans, therefore we assume that this gene was already present in the ancestor of the whole Bilateria group, so we assign level number 7 for this gene.
Subnetworks for all ten levels were generated with the program Cytoscape [50] so that all the nodes and the corresponding edges, which emerged later than the present level, were eliminated from the interaction network. Thus, network level 0 is equivalent to the original protein-protein interaction network; whereas networks with higher level numbers represent the network at earlier steps of evolution with a fewer number of nodes and edges (Table 1). Statistics and different network parameters were calculated for the subnetworks using the igraph R library [51].
PPI interactions for D. melanogaster and C. elegans
Experimentally derived data for low level PPI subnetworks in fruitfly and worm was acquired from the IntAct [42] and PIMRider [43] databases, respectively. Orthologs of human immunome proteins were identified in these genomes using data from the ImmTree database. Then, interactions between the immunome ortholog proteins were identified from the datasets and included to the low level networks. Interactions in the fruitfly data were introduced to the Coelomata ancestor's subnetwork (level 6) and worm data to the Bilateria ancestor's subnetwork (level 7). There were 132 immunome ortholog proteins identified in fruitfly and 27 in worm. The interaction datasets contained 13 new interactions between these proteins. These interactions were analysed similar to the human PPI network derived data. Thus, interactions were maintained in the earlier subnetworks only if both the interacting proteins were present on that level.
Degree distribution of the subnetworks
Power law distribution was fitted to the distribution of degrees in all subnetworks. The power law exponent (α) was estimated with its standard error by maximum likelihood method.
Average entropy of the proteins
where p i is the frequency of residues from class i at the position. The following six classes of amino acids were used: aliphatic (A, V, L, I, M, C), aromatic (F, W, Y, H), polar (S, T, N, Q), basic (K, R), acidic (D, E) and special conformation (G, P). The arithmetic mean of the entropy was calculated for those sites, where at least 50%+1 of the sequences was present in order to avoid the overestimation of conservation caused by long unique sequence parts in the alignment, which usually appear at the ends of the alignment.
Efficiency of the network
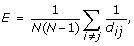
where d ij is the distance between the i-th and j-th nodes as the minimal number of edges on the shortest path between them.
Expected efficiency of the networks
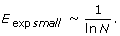
Maximum vulnerability of the networks

where E is the global efficiency of the network while E i is the global efficiency of the network without the node i and all of its interactions. The overall vulnerability of the network is the value of the most vulnerable node, i.e. the largest loss in performance when a node is deleted from the network. The smaller the value for vulnerability the more stable the network is against random node removal.
Visualization of the results
from the median on the sides of the boxes, and represent roughly a 95% confidence interval for the medians. If the notches of two plots do not overlap it is a strong evidence that the two medians differ.
Declarations
Acknowledgements
We thank the Medical Research Fund of Tampere University Hospital and the CAMKIN Research Network of the European Commission for financial support.
Authors’ Affiliations
References
- Vespignani A: Evolution thinks modular. Nat Genet 2003, 35:118–119.View ArticlePubMedGoogle Scholar
- Milo R, Shen-Orr S, Itzkovitz S, Kashtan N, Chklovskii D, Alon U: Network motifs: simple building blocks of complex networks. Science 2002, 298:824–827.View ArticlePubMedGoogle Scholar
- Shen-Orr SS, Milo R, Mangan S, Alon U: Network motifs in the transcriptional regulation network of Escherichia coli. Nat Genet 2002, 31:64–68.View ArticlePubMedGoogle Scholar
- Wuchty S, Oltvai ZN, Barabasi AL: Evolutionary conservation of motif constituents in the yeast protein interaction network. Nat Genet 2003, 35:176–179.View ArticlePubMedGoogle Scholar
- Mazurie A, Bottani S, Vergassola M: An evolutionary and functional assessment of regulatory network motifs. Genome Biol 2005, 6:R35.View ArticlePubMedGoogle Scholar
- Berg J, Lassig M, Wagner A: Structure and evolution of protein interaction networks: a statistical model for link dynamics and gene duplications. BMC Evol Biol 2004, 4:51.View ArticlePubMedGoogle Scholar
- Beltrao P, Serrano L: Specificity and evolvability in eukaryotic protein interaction networks. PLoS Comput Biol 2007, 3:e25.View ArticlePubMedGoogle Scholar
- Bloom JD, Adami C: Apparent dependence of protein evolutionary rate on number of interactions is linked to biases in protein-protein interactions data sets. BMC Evol Biol 2003, 3:21.View ArticlePubMedGoogle Scholar
- Jordan IK, Wolf YI, Koonin EV: No simple dependence between protein evolution rate and the number of protein-protein interactions: only the most prolific interactors tend to evolve slowly. BMC Evol Biol 2003, 3:1.View ArticlePubMedGoogle Scholar
- Plotkin JB, Fraser HB: Assessing the determinants of evolutionary rates in the presence of noise. Mol Biol Evol 2007, 24:1113–1121.View ArticlePubMedGoogle Scholar
- Drummond DA, Raval A, Wilke CO: A single determinant dominates the rate of yeast protein evolution. Mol Biol Evol 2006, 23:327–337.View ArticlePubMedGoogle Scholar
- Stumpf MP, Kelly WP, Thorne T, Wiuf C: Evolution at the system level: the natural history of protein interaction networks. Trends Ecol Evol 2007, 22:366–373.View ArticlePubMedGoogle Scholar
- Amoutzias GD, Pichler EE, Mian N, De Graaf D, Imsiridou A, Robinson-Rechavi M, Bornberg-Bauer E, Robertson DL, Oliver SG: A protein interaction atlas for the nuclear receptors: Properties and quality of a hub-based dimerisation network. BMC Syst Biol 2007, 1:34.View ArticlePubMedGoogle Scholar
- Qin H, Lu HH, Wu WB, Li WH: Evolution of the yeast protein interaction network. Proc Natl Acad Sci USA 2003, 100:12820–12824.View ArticlePubMedGoogle Scholar
- Litman GW, Cooper MD: Why study the evolution of immunity? Nat Immunol 2007, 8:547–548.View ArticlePubMedGoogle Scholar
- Ortutay C, Siermala M, Vihinen M: Molecular characterization of the immune system: emergence of proteins, processes, and domains. Immunogenetics 2007, 59:333–348.View ArticlePubMedGoogle Scholar
- Ortutay C, Vihinen M: A reference set of genes and proteins for systems biology of the human immune system. Cell Immunol 2006, 244:87–89.View ArticlePubMedGoogle Scholar
- Ortutay C, Siermala M, Vihinen M: ImmTree: Database of evolutionary relationships of genes and proteins in the human immune system. Immunome Res 2007, 3:4.View ArticlePubMedGoogle Scholar
- Mathivanan S, Periaswamy B, Gandhi TK, Kandasamy K, Suresh S, Mohmood R, Ramachandra YL, Pandey A: An evaluation of human protein-protein interaction data in the public domain. BMC Bioinformatics 2006,7(Suppl 5):S19.View ArticlePubMedGoogle Scholar
- Bales ME, Johnson SB: Graph theoretic modeling of large-scale semantic networks. J Biomed Inform 2006, 39:451–464.View ArticlePubMedGoogle Scholar
- Amaral LA, Scala A, Barthelemy M, Stanley HE: Classes of small-world networks. Proc Natl Acad Sci USA 2000, 97:11149–11152.View ArticlePubMedGoogle Scholar
- Doherty IA, Padian NS, Marlow C, Aral SO: Determinants and consequences of sexual networks as they affect the spread of sexually transmitted infections. J Infect Dis 2005,191(Suppl 1):S42–54.View ArticlePubMedGoogle Scholar
- von Mering C, Krause R, Snel B, Cornell M, Oliver SG, Fields S, Bork P: Comparative assessment of large-scale data sets of protein-protein interactions. Nature 2002, 417:399–403.View ArticlePubMedGoogle Scholar
- Fraser HB, Hirsh AE, Steinmetz LM, Scharfe C, Feldman MW: Evolutionary rate in the protein interaction network. Science 2002, 296:750–752.View ArticlePubMedGoogle Scholar
- Pastor-Satorras R, Vespignani A: Epidemic spreading in scale-free networks. Phys Rev Lett 2001, 86:3200–3203.View ArticlePubMedGoogle Scholar
- Schintler L, Gorman S, Reggiani A, Patuelli R, Gillespie A, Nijkamp P, Rutherford J: Complex network phenomena in telecommunication systems. Network Spatial Econ 2005, 5:351–370.View ArticleGoogle Scholar
- Onnela JP, Saramaki J, Hyvonen J, Szabo G, Lazer D, Kaski K, Kertesz J, Barabasi AL: Structure and tie strengths in mobile communication networks. Proc Natl Acad Sci USA 2007, 104:7332–7336.View ArticlePubMedGoogle Scholar
- Albert R, Jeong H, Barabasi AL: Error and attack tolerance of complex. Nature 2000, 406:378–382.View ArticlePubMedGoogle Scholar
- Xulvi-Brunet R, Sokolov IM: Growing networks under geographical constraints. Phys Rev E Stat Nonlin Soft Matter Phys 2007, 75:046117.PubMedGoogle Scholar
- Barabasi AL, Albert R: Emergence of scaling in random networks. Science 1999, 286:509–512.View ArticlePubMedGoogle Scholar
- Dorogovtsev SN, Mendes JF: Scaling properties of scale-free evolving networks: continuous approach. Phys Rev E Stat Nonlin Soft Matter Phys 2001, 63:056125.PubMedGoogle Scholar
- Koonin EV, Wolf YI, Karev GP: The structure of the protein universe and genome evolution. Nature 2002, 420:218–223.View ArticlePubMedGoogle Scholar
- Eisenberg E, Levanon EY: Preferential attachment in the protein network evolution. Phys Rev Lett 2003, 91:138701.View ArticlePubMedGoogle Scholar
- Eriksen KA, Hornquist M: Scale-free growing networks imply linear preferential attachment. Phys Rev E Stat Nonlin Soft Matter Phys 2002, 65:017102.PubMedGoogle Scholar
- Wuchty S, Ravasz E, Barabasi AL: The Architecture of Biological Networks. Complex Systems in Biomedicine (Edited by: Deisboeck TS YKJ, Kepler TB). New York: Kluwer Academic Publishing 2003.Google Scholar
- Barabasi AL, Oltvai ZN: Network biology: understanding the cell's functional organization. Nat Rev Genet 2004, 5:101–113.View ArticlePubMedGoogle Scholar
- Yook SH, Oltvai ZN, Barabasi AL: Functional and topological characterization of protein interaction networks. Proteomics 2004,4(4):929–842.View ArticleGoogle Scholar
- Dorogovtsev S, Mendes J: Evolution of networks: from biological nets to the Internet and WWW Oxford: Oxford University Press 2003.Google Scholar
- Palla G, Barabasi AL, Vicsek T: Quantifying social group evolution. Nature 2007, 446:664–667.View ArticlePubMedGoogle Scholar
- Wuchty S: Evolution and topology in the yeast protein interaction network. Genome Res 2004, 14:1310–1314.View ArticlePubMedGoogle Scholar
- Wuchty S, Barabasi AL, Ferdig MT: Stable evolutionary signal in a yeast protein interaction network. BMC Evol Biol 2006, 6:8.View ArticlePubMedGoogle Scholar
- Kerrien S, Alam-Faruque Y, Aranda B, Bancarz I, Bridge A, Derow C, Dimmer E, Feuermann M, Friedrichsen A, Huntley R: IntAct-open source resource for molecular interaction data. Nucleic Acids Research 2006, 35:D561–565.View ArticlePubMedGoogle Scholar
- Colland F, Jacq X, Trouplin V, Mougin C, Groizeleau C, Hamburger A, Meil A, Wojcik J, Legrain P, Gauthier J: Functional proteomics mapping of a human signaling pathway. Genome Research 2004, 14:1324–1332.View ArticlePubMedGoogle Scholar
- Yu H, Luscombe N, Lu H, Zhu X, Xia Y, Han J, Bertin N, Chung S, Vidal M, Gerstein M: Annotation transfer between genomes: protein-protein interologs and protein-DNA regulogs. Genome Research 2004, 14:1107–1118.View ArticlePubMedGoogle Scholar
- Liang Z, Xu M, Teng M, Niu L: Comparison of protein interaction networks reveals species conservation and divergence. BMC Bioinformatics 2006, 7:457.View ArticlePubMedGoogle Scholar
- Hurst LD, Smith NG: Do essential genes evolve slowly? Curr Biol 1999, 9:747–750.View ArticlePubMedGoogle Scholar
- Mirny L, Shakhnovich E: Evolutionary conservation of the folding nucleus. J Mol Biol 2001, 308:123–129.View ArticlePubMedGoogle Scholar
- Latora V, Marchiori M: Efficient behavior of small-world networks. Phys Rev Lett 2001, 87:198701.View ArticlePubMedGoogle Scholar
- Gol'dshtein V, Koganov G, Surdutovich G: Vulnerability and hierarchy of complex networks. Arxiv preprint cond-mat/0409298 2004.Google Scholar
- Shannon P, Markiel A, Ozier O, Baliga NS, Wang JT, Ramage D, Amin N, Schwikowski B, Ideker T: Cytoscape: a software environment for integrated models of biomolecular interaction networks. Genome Res 2003, 13:2498–2504.View ArticlePubMedGoogle Scholar
- Csardi G, Nepusz T: The igraph software package for complex network research. InterJournal Complex Systems 2006, 1695.Google Scholar
Copyright
This article is published under license to BioMed Central Ltd. This is an Open Access article distributed under the terms of the Creative Commons Attribution License (http://creativecommons.org/licenses/by/2.0), which permits unrestricted use, distribution, and reproduction in any medium, provided the original work is properly cited.